
Ever heard the term “backtesting”? It’s a fancy way of saying you’re taking a trading strategy for a spin using historical data. You’re doing research to see how your rules would have held up in past market conditions.
This process involves defining your rules, running simulated trades, and looking at the performance numbers. It’s the single most important step before you even think about putting real money on your trading strategy.
What Backtesting Really Means for Your Strategy
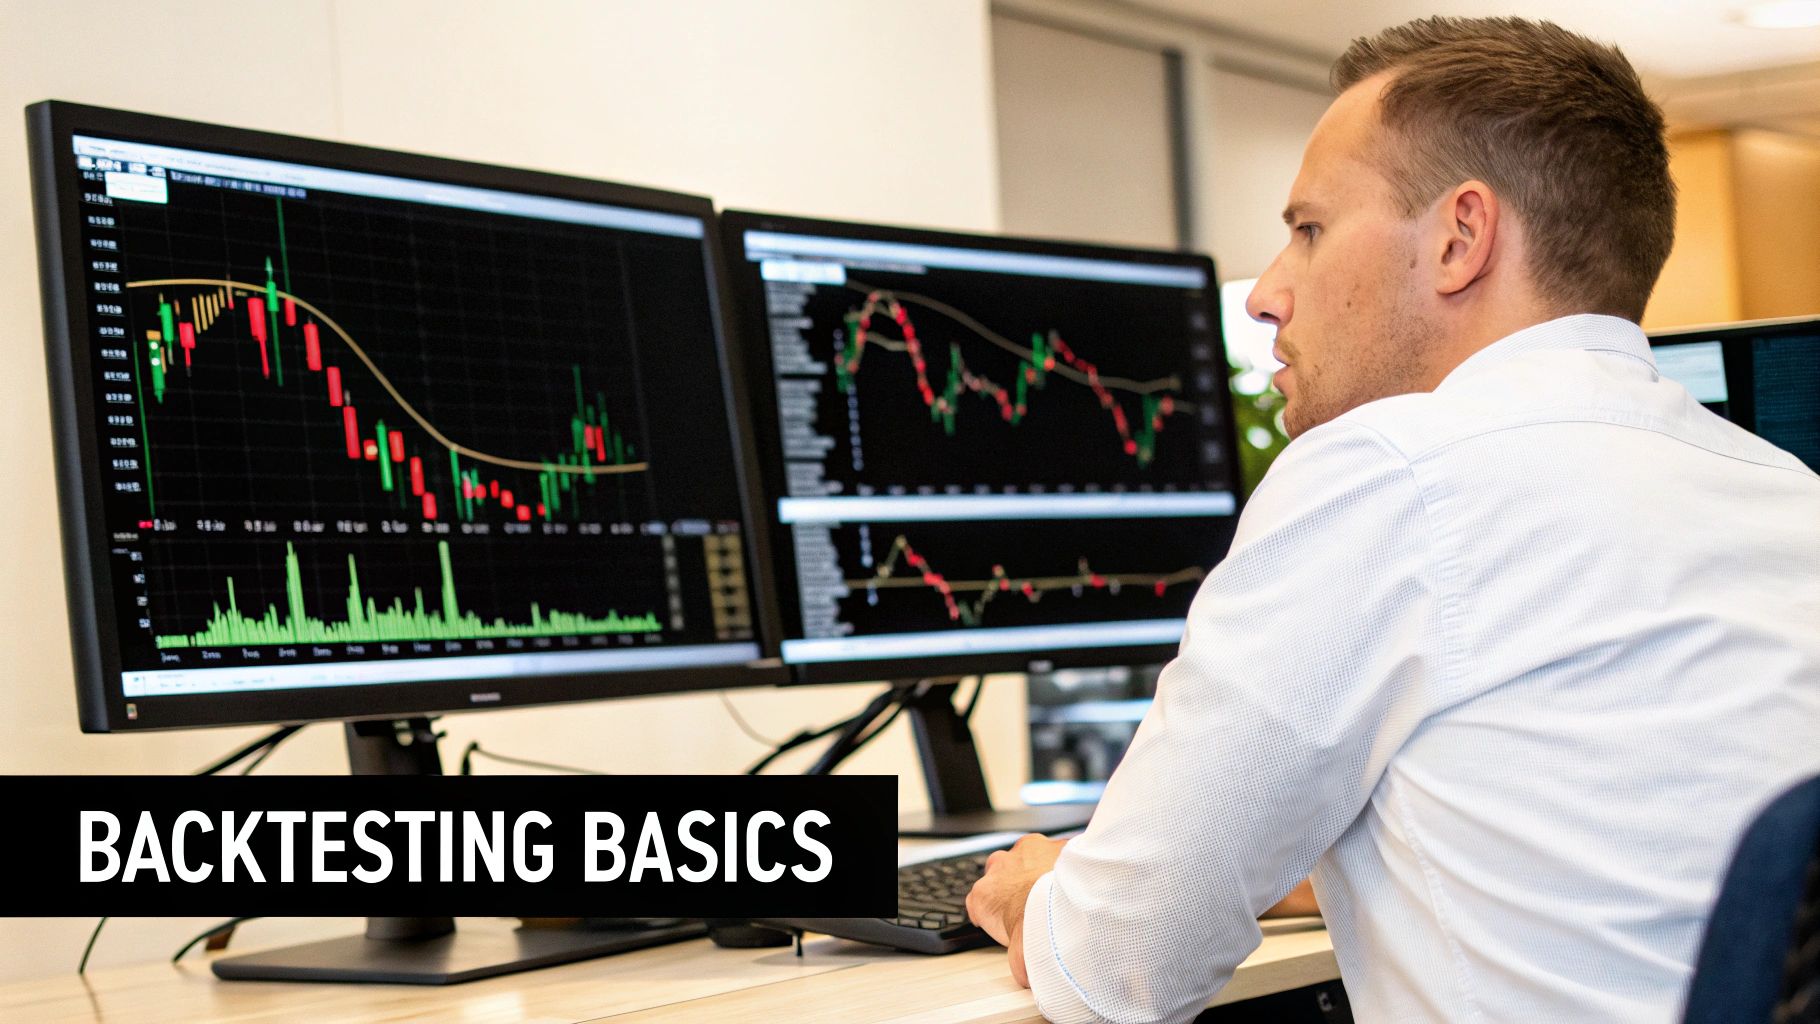
Think of backtesting as a simulator for your trading ideas. It reveals the true character of your strategy.
The main goal here is to see how your strategy would have navigated the market’s ups and downs. This helps with uncovering hidden flaws, setting realistic expectations, and building the rock-solid confidence you need to stick to your plan when things get tough.
Beyond Simple Profit and Loss
A lot of new traders think backtesting is just about seeing if an idea would have made money. Profit is part of the story, but a proper backtest tells you much more.
- Your Risk Profile: It helps you get a real number on potential risks. You’ll discover your maximum drawdown, which is the biggest drop from a peak your account might suffer. That number is critical. We break down all types of prop firm drawdowns you’ll encounter in our article here.
- Performance Consistency: Does your strategy only work in a trending bull market? A good backtest shows you how it holds up when markets go up, down, or sideways.
- Psychological Obstacles: Knowing your strategy can have a 10-trade losing streak (and still be profitable long-term) is what helps you not panic and abandon it at the worst possible moment.
This isn’t just for retail traders. Hedge funds and quant firms run incredibly advanced backtests, simulating thousands of trades over decades of data to stress-test every single strategy.
The point of backtesting isn’t to find a flawless strategy. It’s about deeply understanding how your strategy behaves in different market conditions, so you can execute it with discipline and set your expectations right.
Here’s what makes backtesting effective:
Core Components of Effective Backtesting
| Component | Why It Matters | Key Consideration |
|---|---|---|
| Clean, Quality Data | Flawed data leads to flawed results. | Use reputable data sources. Account for survivorship bias and data adjustments like splits. |
| Realistic Costs | Forgetting costs inflates performance and gives a false sense of security. | Always include commissions, slippage, and any other trading fees. |
| Sufficient Timeframe | A short backtest might catch a lucky streak, not a robust strategy. | The data should cover multiple market cycles (bull, bear, sideways). |
| Defined Trading Rules | Ambiguous rules are impossible to test consistently or execute live. | Every entry, exit, and position sizing rule must be crystal clear and mechanical. |
| Performance Metrics | Profit alone is a vanity metric. You need to understand risk and consistency. | Analyze Sharpe ratio, max drawdown, profit factor, and win rate. |
Getting these components right is what separates wishful thinking from having an edge. It builds a foundation of trust in your system, which is crucial in live trading.
Finding Quality Historical Data for Your Backtesting
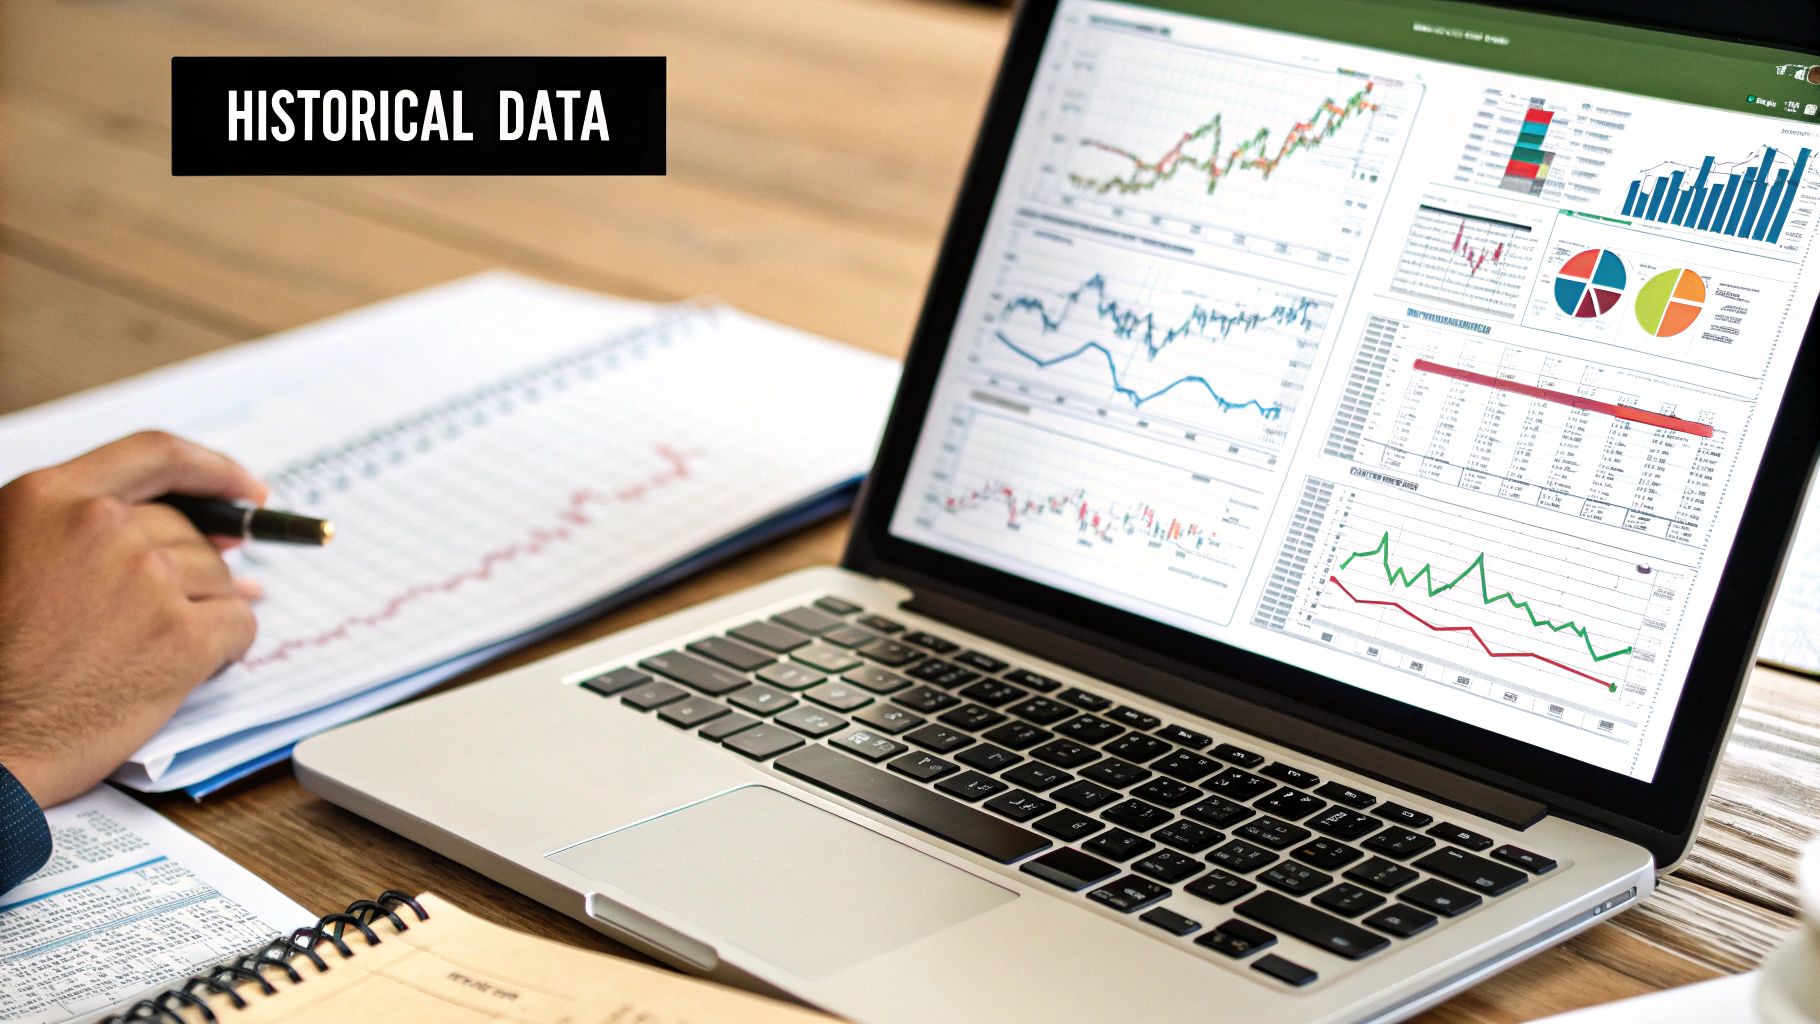
Your backtesting is only as good as the data you feed it. Think of data as the foundation of a house. If you build on a cracked, weak foundation, it doesn’t matter how brilliant your architectural plans are, the whole thing is coming down.
Sourcing high-quality, clean historical data is the first step. Otherwise, you’re just fooling yourself with flawed results, a mistake that becomes expensive when you go live.
Can Your Strategy Survive Different Markets?
A classic rookie mistake is testing a strategy using data from just one market condition. A simple “buy the dip” strategy will look like the holy grail if you only test it during a massive bull run. But what happens when the market chops sideways for two years? Or when it nosedives?
To build a strategy that can actually last, you have to throw everything at it. That means your data needs to cover a mix of market cycles:
- Bull Markets: Those long, sustained periods of upward movement.
- Bear Markets: The painful, prolonged downturns that crush unprepared traders.
- Sideways Markets: The choppy, trendless periods that frustrate most systems.
Testing across these conditions is how you find out if you have an all-weather performer or just a one-trick pony. You need to know what conditions you’re best at trading, especially if you’re aiming for a funded account with a prop firm where consistent results are everything.
The Hidden Traps in Your Data
Beyond just covering different market cycles, there are other data problems that can throw off your backtesting.
The most notorious trap is survivorship bias. This happens when your dataset only includes the assets that survived the test period. It conveniently forgets to mention all the trades that were losing ones, relied too much on hindsight, or are just not objective enough to fit the sample size. Backtesting with skewed data will look amazing because it ignores all the ways you could have lost.
To get a true picture, your data must include everything: wins, losses, breakevens, missed trades, etc.
Professional traders know that reliable backtesting requires data reflecting live trading conditions, which includes every possible outcome. That’s why industry guidelines often push for at least 5 to 10 years of data. It’s the only way to capture multiple economic cycles and see how a strategy truly holds up.
Picking the Right Data
Finally, you have to match the data’s timeframe to your trading style. The data you need depends entirely on your strategy.
- Daily Data (1D): Perfect for swing traders or position traders who make decisions based on where the market closes each day.
- Intraday Data (1H, 15M, 5M): This is the bread and butter for day traders who are in and out of positions within the same session. It also means you’ll have to account for a lot more timeframes when you’re going back in past price action.
Trying to test a 5-minute scalping strategy with daily data is pointless; the results will be completely meaningless. You have to sync the data with your strategy’s timeframe. It’s the only way to get a simulation that even remotely resembles what would happen in a live market.
Choosing Your Backtesting Tools and Platform
Once you’ve got your hands on some quality data, you have to pick your backtesting tool or platform. The goal is to find a tool that matches your strategy’s complexity and allows you to go back in time and gather the metrics that matter. There’s no single “best” tool, and the options range from a simple spreadsheet all the way to automated software that does a lot of the work for you.
Spreadsheets: The Manual Approach
For really basic strategies, like a simple moving average crossover on daily charts, you’d be surprised what you can do with a spreadsheet. Whether it’s Excel or Google Sheets, you can manually plug in your data, write formulas for your entry and exit signals, and start backtesting.
Doing things manually forces you to understand every single decision happening behind the scenes of your trading strategy. However, it’s incredibly slow, with a lot of potential for human error, and just isn’t practical for more advanced strategies or big datasets.
Dedicated Backtesting Software
A massive leap forward from spreadsheets is dedicated backtesting software. Platforms like TradeZella or even TradingView’s built-in bar replay feature give you a user-friendly interface where you can test ideas without writing a single line of code.
The most popular backtesting tool in the industry right now is FXReplay, and we’ve got a great discount waiting for you in PipBack.
These platforms are popular for a reason. They usually come packed with features:
- Vast Historical Data: Access to data across stocks, forex, and futures is often included right out of the box.
- Intuitive Interfaces: You can set up your strategy and automate a lot of aspects without knowing how to code.
- Visual Replay: This is a big one. Watching your strategy unfold candle-by-candle helps build a powerful intuition for how it behaves.
- Pre-Built Metrics: They instantly calculate all the key stats you need, like Sharpe ratio, max drawdown, and win rate.
The main benefit here is speed and convenience.
Comparison of Backtesting Methods
| Method | Best For | Pros | Cons |
|---|---|---|---|
| Spreadsheets | Beginners & simple, low-frequency strategies. | Forces you to learn the math; very low-cost. | Slow, error-prone, not scalable, very limited. |
| Dedicated Software | Most retail traders (beginner to intermediate). | Fast, user-friendly, visual, good built-in data. | Limited customization, potential subscription costs. |
| Custom Code (Python) | Advanced traders, quants, & developers. | Unlimited flexibility, complete control, highly scalable. | Steep learning curve, requires programming skills. |
Ultimately, the right tool is the one that gets you from idea to validated result with the least amount of friction. Don’t overcomplicate it. Start with what’s accessible and move to more advanced tools only when your trading demands it.
Simulating Real-World Trading Conditions
Accounting for the Costs of Doing Business
In a perfect world, every trade is free. But all trades have a cost in a live environment. These little fees might seem insignificant, but they can, and will, turn a supposedly profitable strategy into a consistent money pit, especially if you’re trading frequently and not accounting for your commissions, spread, etc.
Your simulation absolutely has to factor in these details:
- Commissions: This is the fee your broker charges just for placing the trade. It could be a flat rate or it might be based on how many shares you trade.
- Slippage: Ever tried to buy during a fast move and got a worse price than you clicked? That’s slippage. It’s the gap between your expected price and the actual execution price, and it almost always works against you. You can read more about it here.
- Bid-Ask Spread: This is the constant, built-in cost of trading. You always buy at the higher ‘ask’ price and sell at the lower ‘bid’ price. That difference, the spread, is an instant loss you have to overcome just to break even.
If you have a scalping strategy that aims for a quick $10 profit, but your round-trip commissions and average spread add up to $7, your real profit is just $3. A couple of bad trades could easily wipe out the gains from dozens of winning ones.
Realistic Capital and Position Sizing
Another classic mistake is testing a strategy with a dream account size. Running a backtest with a hypothetical $1 million when you’re planning to trade with $5,000 is completely useless. The results simply won’t translate. You need to set your expected value of every trade properly.
Start your backtesting with the exact amount of capital you plan to trade with. From there, you have to nail down your position sizing rules. A solid rule of thumb is to risk no more than 1% to 2% of your total capital on any single trade. This is what keeps one or two unexpected losses from blowing up your account. We break down prop firm risk management fully in this dedicated post.
Backtesting isn’t just about seeing if your entries work. It’s about stress-testing your entire trading plan, including your risk management. Your results must show how your strategy holds up during the inevitable losing streaks. Simulating this properly prepares you for the psychological hurdle of a real drawdown.
How your strategy handles drawdowns is very important as well. You should know the different types of drawdowns in prop firm trading and how they’re calculated.
By addressing all of these aspects into your backtesting, you transform it from a simple historical replay into a genuinely valuable simulation. The goal isn’t to find a strategy that looks perfect on paper, it’s to create one that can survive the markets and give you an edge.
Interpreting Your Backtesting Results
Once you’re done backtesting, you’re now staring at a wall of numbers. Knowing how to read and interpret the data from these results is what really matters. The real story is buried in the details: the performance, the risk, the drawdown, and most importantly, the consistency.
Moving Beyond the Bottom Line
A massive drawdown can wreck you psychologically long before it wrecks your account.
You need to look at a balanced scorecard of metrics to understand your strategy’s true characteristics. Key metrics like the Sharpe ratio, profit factor, and max drawdown paint the full picture of your system’s risk and reward.
To make sure your results aren’t just a lucky streak, you need a decent sample size. Most experienced traders won’t even consider results with fewer than 100-200 trades. Anything less is just noise.
Key Metrics That Truly Matter
These are the performance indicators you absolutely have to understand.
- Maximum Drawdown (Max DD): This might be the single most important risk metric. It shows you the biggest drop your account took from its peak. If your Max DD was 40%, be honest with yourself: could you really sit there and watch your account bleed that much without panicking and pulling the plug? Most people can’t.
- Sharpe Ratio: Think of this as your “risk-adjusted return.” It measures how much return you got for the amount of risk you took on. A higher Sharpe ratio (anything over 1.0 is generally considered good) means you’re getting paid well for the volatility you’re dealing with.
- Profit Factor: Simple, yet incredibly powerful. This is just your total profits from winning trades divided by your total losses from losing trades. A profit factor of 2.0 means you made twice as much money on winners as you lost on losers. If it’s below 1.0, the strategy is a net loser.
A strategy with a lower total return but a much smaller maximum drawdown and a higher Sharpe ratio is often superior to a high-return strategy that takes your account balance on a terrifying rollercoaster ride.
Analyzing the Trade-Offs
There’s no such thing as a perfect strategy. Every system has its trade-offs. Your job is to analyze them and decide if they match your risk tolerance and trading psychology. For example, a strategy might have a fantastic win rate, but the few losses it takes are so huge they wipe out weeks of small gains.
This level of detailed analysis is important, especially if you’re aiming to pass a prop firm challenge where the drawdown you get is limited to just a few percent. Prop firms are obsessed with your risk management and have strict daily and maximum drawdown limits.
Understanding how your strategy behaves under pressure is critical to passing the various evaluation types in prop firm trading.
FAQ
- What’s the biggest mistake I can make when backtesting?
It’s something called overfitting, or curve-fitting. This is what happens when you get a little too good at tweaking your strategy on historical data. You end up creating a system that’s perfectly tailored to past market moves, not a genuine, repeatable edge.
A strategy that has been overfit looks incredible on paper. The backtesting results are flawless. But the moment you put it into a live market, it completely falls apart. Why? Because real trading is chaotic and can have slight differences every time.
A simple, robust strategy that performs reasonably well in different market conditions is always better than a complex one that was “perfect” in backtesting. If your results seem too good to be true, they almost certainly are.
The best defense against this is testing your strategy on out-of-sample data. This is simply a portion of historical data your strategy has never seen before. It’s the most honest way to gauge its real potential.
- My backtesting was a success! What now?
Hold off on funding your live account just yet. Successful backtesting is your green light to move on to the next crucial phase: forward performance testing, also known as “paper trading.”
You’ll run your strategy in a live market simulation, with real-time data, but without a single dollar of your own money on the line. This step is important for a few reasons:
-
- It proves your strategy works under current market conditions, not just historical ones.
- It acts as a bridge between the sterile environment of backtesting and the reality of live trading.
- It’s a test of you, meaning, can you execute the strategy with discipline, without letting emotions get in the way?
- How much historical data do I really need?
There’s no magic number, but the general answer is “probably more than you think.” As long as the data is high quality, more is usually better.
A good rule of thumb is to use at least 5 to 10 years of data. This helps ensure your system has been tested through various market cycles, including bull, bear, and everything in between.
The real goal here is to get enough data to produce a statistically significant number of trades, ideally over 100. This gives you real confidence that your results aren’t just a fluke.